Focus Groups: Competitor choice
This tab appears when the session includes structured competitor-choice data (typical for GEO-linked flows). It turns modeled preferences across brands into summary bars, per-round cards, a persona-by-step matrix, and finally the raw “what they said” plus probability splits. If the report is older than the current schema, you may see an “outdated report” notice instead—run a new focus group linked to GEO to populate these blocks.
Summary
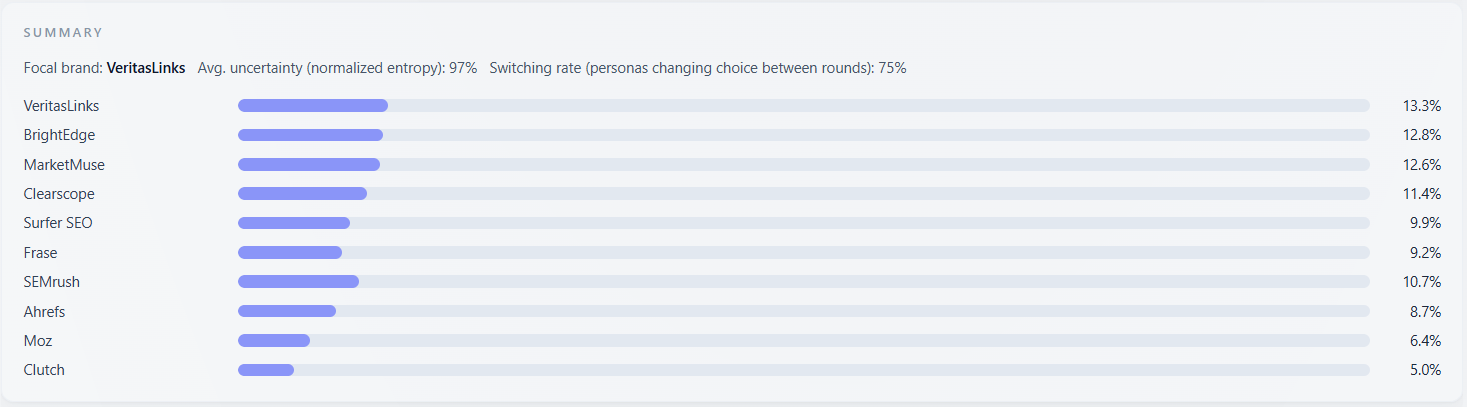
Section label: “Summary”. It anchors the whole tab: which brand is the focal one in the analysis, how uncertain the group was on average, how often personas changed their top pick between steps, and the overall share of preference each option received.
What it means
- Focal brand: the brand this run is about (in blind GEO-linked setups participants see Option A/B/… labels; your brand is one of them after shuffle, and they are not told which option is “yours”).
- Avg. uncertainty (normalized entropy): higher values mean the group was split or unsure; lower values mean probability mass concentrated on one or two options.
- Switching rate: share of persona-steps where the top choice changed from one round to the next—signals persuasion or confusion as the scenario evolved.
- Bars under each option: overall average modeled probability after aggregating rounds (same scale as elsewhere on the tab, typically read as percent).
How to read the data
- Compare bar length before reading entropy: a long bar for one rival with low entropy means a clear loser position for others.
- If focal brand is mid-pack, pair Summary with Persona journey to see whether one segment saves you or everyone is lukewarm.
How to use it
Use Summary as the executive slide: one screenshot of the bars plus two numbers (uncertainty, switching) tells stakeholders whether the competitive set is stable or volatile.
How each round played out
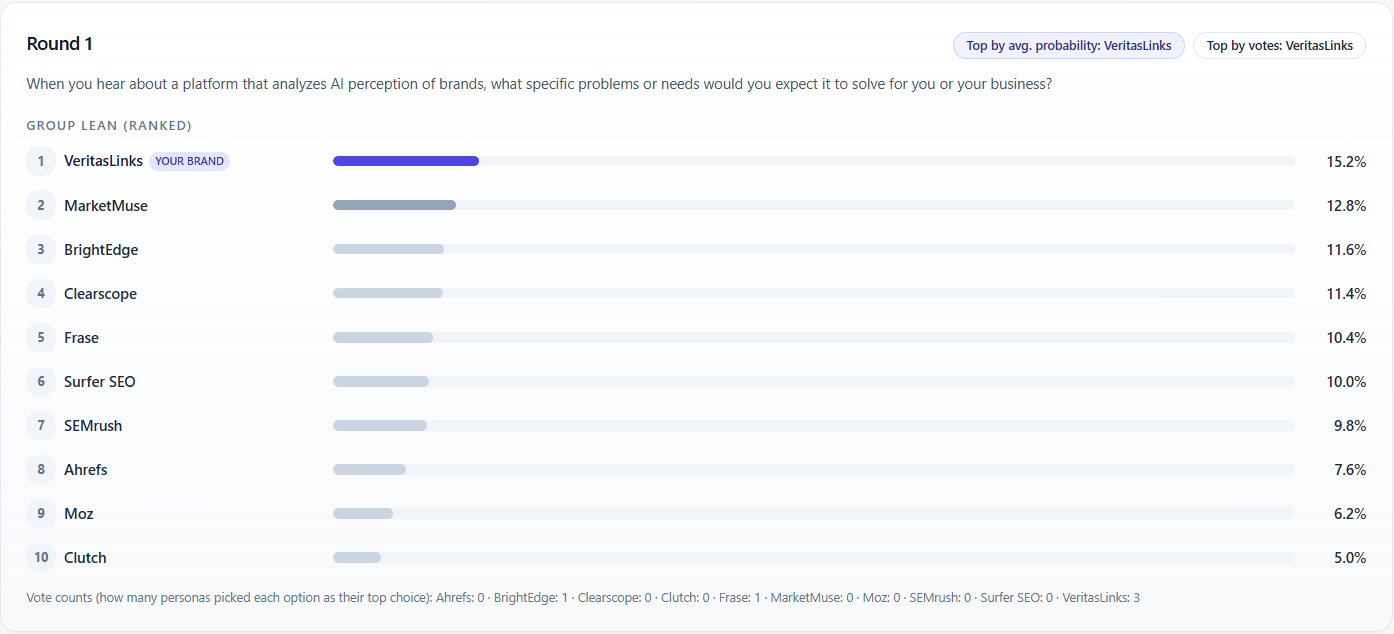
Section label: “How each round played out”. One card per moderator question (“round”), sorted so the strongest group-level lean appears first. Each card shows the question text (possibly truncated), two leader tags, a ranked “Group lean” list, and optional vote counts.
What it means
- Top by avg. probability: the option with the highest average modeled probability across personas after that question—statistical “center of mass” for the group.
- Top by votes: the option most often chosen as each persona’s single strongest pick when those differ from the average-probability leader.
- Group lean (ranked): full stack of options for that round with bars from avg_probs.
- Vote counts: how many personas named each option as their top choice—useful when distributions are flat.
How to read the data
- When “avg prob” and “votes” disagree, the group had soft consensus on one brand but hard picks on another—messaging implications differ (comfort vs decisive preference).
- Read questions in order of appearance in the session if you need narrative flow; use the UI sort when you care about strongest competitive swings only.
How to use it
Pick the two or three rounds that best match your real sales stages (discovery vs comparison vs pricing) and map counter-messaging to the leader tags on those rounds only.
Persona journey across rounds
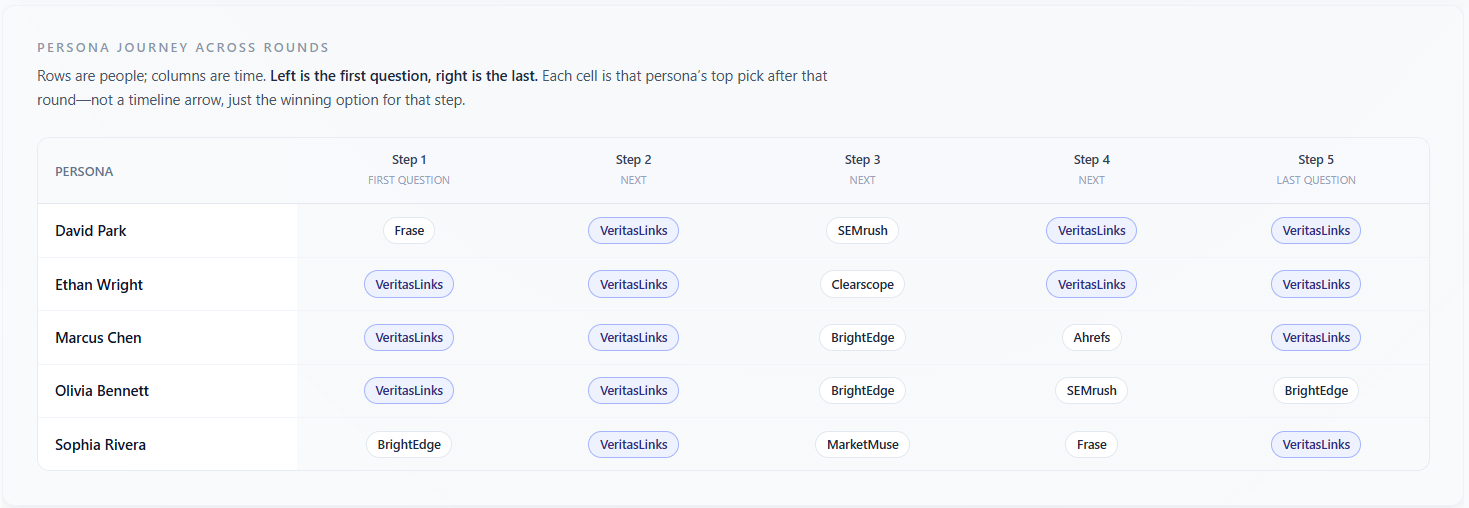
Section label: “Persona journey across rounds”. A table: row = persona name, columns = Step 1, Step 2, … (first question through last). Each cell is that persona’s top pick after that step—not a full distribution, just the winning label.
What it means
The focal brand’s cells often use distinct styling when the pick matches the focal label—so you can scan who ended on you vs a competitor without opening every round card. Empty cells mean no pick was stored for that step.
How to read the data
- Horizontal scan: one persona switching columns shows persuasion or confusion across the scenario.
- Vertical scan: if every persona lands on the same brand by the last step, the competitive story collapsed; if columns stay mixed, you have durable segmentation.
How to use it
Assign sales plays by row: enterprise persona stuck on a rival needs a different proof track than SMB persona oscillating every step.
What participants said & how they scored options
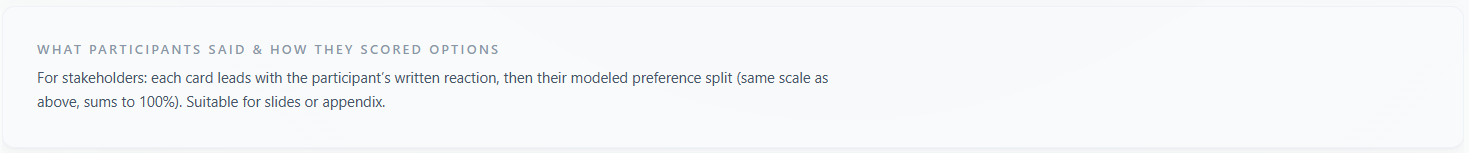
Section label: “What participants said & how they scored options”. Intro copy explains that each following block pairs qualitative reaction text with the same probability scale used above (distributions sum to 100% per persona). This is the stakeholder-friendly layer for quotes in decks.
What it means
The section is a container for one or more discussion steps (see below). The intro does not contain scores itself—it sets expectations that each step card will show both narrative and numbers.
How to read the data
Use it to decide whether to export: if your audience needs verbatim color, scroll into each Discussion step; if they only need aggregates, Summary and Persona journey may suffice.
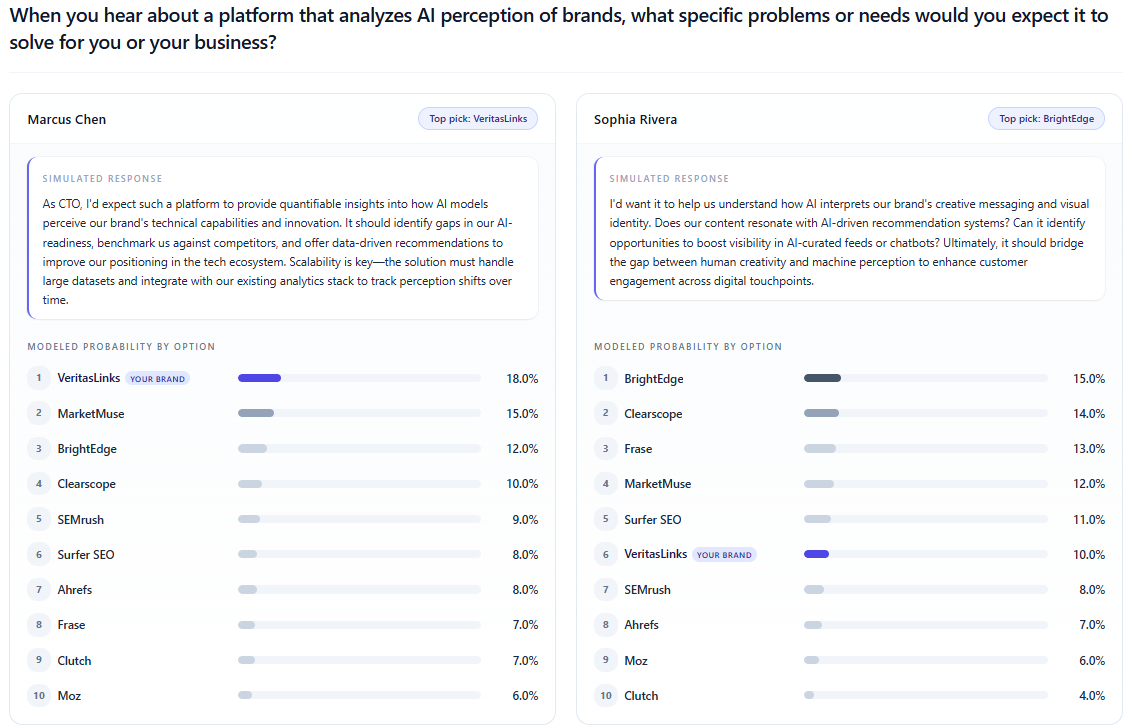
Discussion step №
Each block is headed with small caps “Discussion step” and a number (matching the moderator round). Inside: the step title (short and/or full question), then a grid of persona cards.
What it means
- Simulated response: the persona’s written reaction for that step—qualitative evidence for why probabilities moved.
- Top pick badge (when present): that persona’s strongest single option for the step.
- Modeled probability by option: bar chart of the same labels as Summary, for that persona only—sums to 100% when complete.
How to read the data
- Align response text with bars: if the prose praises Brand A but bars favor Brand B, the model split “sentiment” from “choice”—investigate prompt framing or persona instructions on the next run.
- Compare personas side-by-side in the same step to see segmentation without averaging it away.
How to use it
Lift quotes into sales collateral only with the matching probability line nearby so leadership sees both story and strength of preference.
How the tab fits together
Read top-down: Summary for the verdict, “How each round” for dynamics, Persona journey for segmentation, then “What participants said” / Discussion steps for evidence and quotes. Cross-link to GEO when this run was GEO-linked so votes and narrative match the main report.
Related GEO documentation
Related Focus Groups pages